· Study management &
data collection
· Graduate Certificate
in Gerontology
· Geographic Information Systems (GIS)
· Pittsburgh Regional Economic Model (REMI)

|
Pittsburgh Perspectives |
Archive List | Link to PEQ |
Thursday, July 20, 2023 01:15 PM (60)
What does University of Wisconsin migration research say about recent migration flows impacting Pittsburgh?
Researchers at the Applied Population Laboratory at the University of Wisconsin have updated their past work on net migration flows for US counties. Net migration is the difference between migration inflows and migration outflows and is a key factor in regional population growth and decline.The latest update they describe as a beta release now includes county-level estimates of net migration and the characteristics of net migration between 2010 and 2010. Here this county-level data is compiled to describe the characteristics of net migration for the seven-county Pittsburgh Metropolitan Statistical Area (MSA).*
Between 2010 and 2010, population inflows to the Pittsburgh MSA exceeded outflows by an estimated 75,526 people. Over that same period, the Census Bureau Decennial Censuses shows that the population of the Pittsburgh MSA increased by a far smaller 14,645 people. The key difference between the level of net migration and overall population growth is the impact of natural population change, which is the difference between the number of births and the number of deaths. Most counties in southwestern Pennsylvania have been experiencing natural population decline, the result of a greater number of deaths than births over this period.
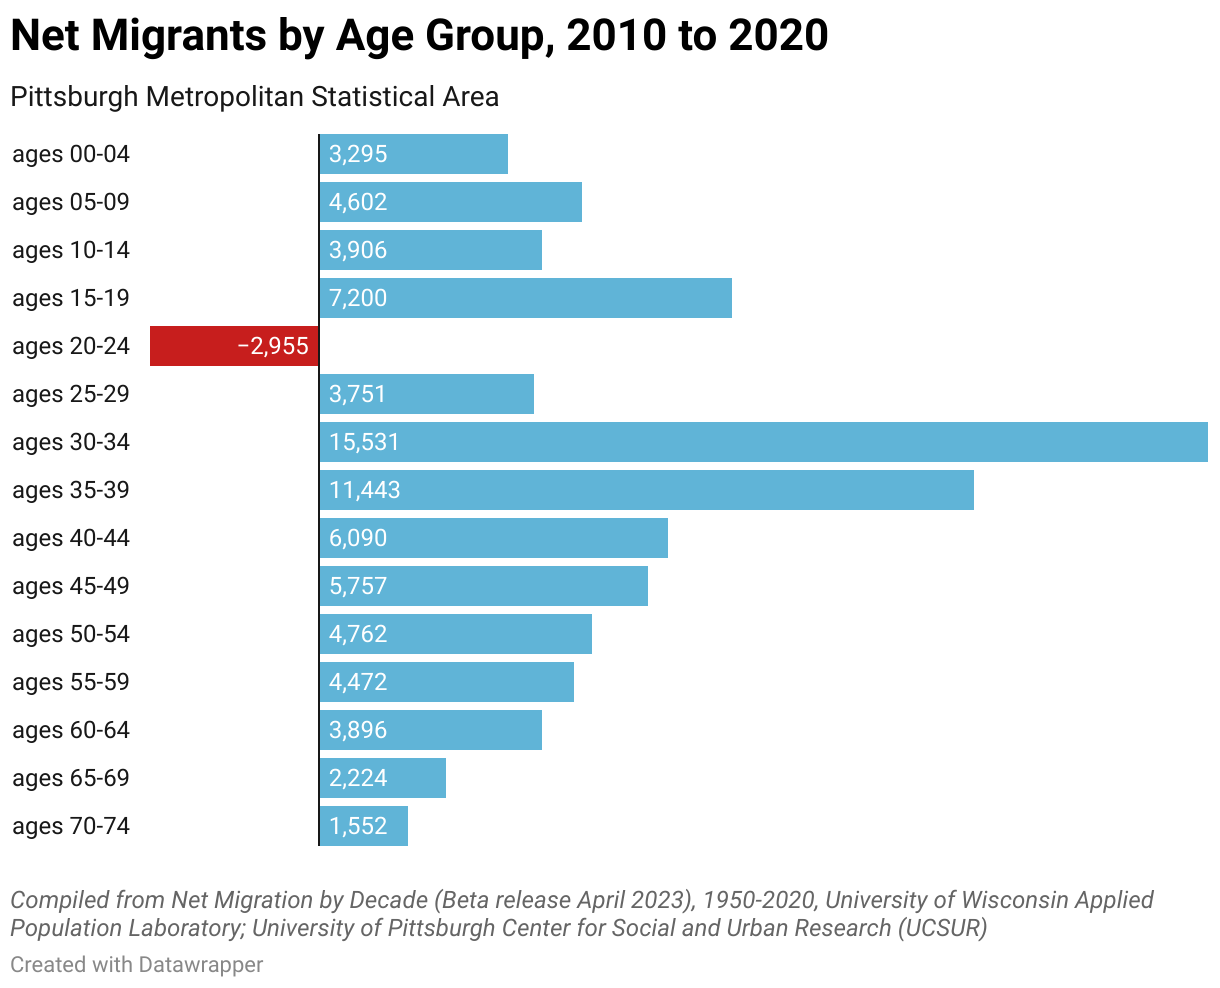
The data also includes detailed information on the characteristics of net migration by race and age group. For the Pittsburgh MSA, the non-Hispanic White population was the largest source of positive net migration (+49,659), followed by the non-Hispanic Asian population (+15,985) while the net migration of the Hispanic population is estimated to be +12,350. The Black non-Hispanic population is estimated to have had a negative net migration, or a total of 2,617 more people leaving the Pittsburgh MSA than arrived over the decade. By age, the largest net migration flows for the Pittsburgh MSA were generated by the population between the ages of 30-34. All age groups are estimated to have had positive net migration into the Pittsburgh MSA over the decade except the population between the ages 20 and 24.
Also calculated is a net migration rate, which is total net migration per 100 people in 2020. For the Pittsburgh MSA, the Hispanic population had the highest net migration rate, at 27.7, followed by a net migration rate of 23.0 for the non-Hispanic Asian population.
Migration patterns vary across counties in the region. Across southwestern Pennsylvania, Butler County had the the highest estimated net migration rate (6.8) followed by Washington County (4.0) and then Allegheny County (3.2). Within the Pittsburgh MSA, Fayette County had the lowest net migration rate (-2.1), but three counties just outside of the Pittsburgh MSA had significantly lower net migation rates: Indiana County (-5.1), Greene County (-5.0) and Lawrence County (-2.2).
Note that this latest release is described as a beta version for data covering the 2010-2020 period, and may be updated in the future. The researchers explain that because of the delayed release of detailed results from 2020 Decennial Census, they used Census Bureau's 2020 "blended base" from its Population Estimates Program, vintage 2021, as the ending population in 2020. As a result, the researchers did not report estimates on net migration for the population aged 75 and over and caution against overinterpretation of net migration estimates for the population age 10 and under. More information on the methodology used to calculate these migration estimates is available on the program’s web page: https://netmigration.wisc.edu/.
________________________________________________________
* The Pittsburgh Metropolitan Statistical Area (MSA) is currently comprised of Allegheny, Armstrong, Beaver, Butler, Fayette, Washington and Westmoreland counties in southwestern Pennsylvania.
References
Egan-Robertson, David, Katherine J. Curtis, Richelle L. Winkler, Kenneth M. Johnson, and Caitlin Bourbeau, Age-Specific Net Migration Estimates for US Counties, 1950-2020. Applied Population Laboratory, University of Wisconsin - Madison, 2023 (Beta Release). Web. [July 19, 2023.] https://netmigration.wisc.edu/.
- 2024-04-05: Regional Labor Force Shifts Since the Onset of COVID-19
- 2024-03-28: 2023 Census Population Estimates for the Pittsburgh Region
- 2023-10-30: Profile of College Students in the Pittsburgh Region
- 2023-07-31: New Definition of the Pittsburgh Metropolitan Statistical Area
- 2023-07-20: What does University of Wisconsin migration research say about recent migration flows impacting Pittsburgh?
- 2023-06-26: Census Population Characteristics - 2022
- 2023-03-02: 2022 Population Estimates for the Pittsburgh Region
- 2023-02-20: IRS Migration Data for Pittsburgh
- 2022-03-25: 2021 Population Estimates for the Pittsburgh Region
- 2022-01-07: Pittsburgh real estate values rising their fastest since the 1970s
- 2021-11-16: Per capita personal income growth in the Pittsburgh region reaches new peak
- 2021-08-24: Preliminary 2020 Population Data for City of Pittsburgh Neighborhoods
- 2021-08-12: First Look at the 2020 Decennial Census: Pittsburgh Region
- 2021-05-05: Final Census Estimates for the Pittsburgh Region Prior to the Decennial Census
- 2021-04-19: EEO Employment Data Update for Pittsburgh
- 2021-02-26: Worker Characteristics of Regional Employment Losses in 2020
- 2020-12-09: Regional GDP Growth
- 2020-12-07: State Employment Projections for the Pittsburgh Region 2018-2028
- 2020-12-03: Pandemic Impacts on Pittsburgh's Restaurant Industry
- 2020-11-23: More on the uneven pandemic impacts in the workforce
- 2020-08-24: EEO Report and Black Workers in the Pittsburgh Region
- 2020-07-01: Changing Age Demographics in the Pittsburgh Region
- 2020-06-23: Foreign-Born Workers in Pittsburgh's Labor Force
- 2020-06-08: Tracking regional unemployment claims
- 2020-05-22: April nonfarm jobs data: Pittsburgh region employment declined by 185,600 over previous month
- 2020-05-18: Strong Regional Gains in Real Personal Income
- 2020-03-30: Statewide Impacts of Business Shutdowns
- 2020-03-26: 2019 Population Estimates for the Pittsburgh region
- 2020-03-20: Estimated Employment Impacts of COVID19 Business Slowdown - March 2020
- 2020-01-16: City of Pittsburgh Neighborhood Profiles
- 2020-01-07: How will the 2020 Census impact redistricting within Pennsylvania?
- 2019-12-12: Ethane cracker construction generates GDP growth for Beaver County
- 2019-11-14: Solid growth for personal income in the Pittsburgh region
- 2019-11-07: Veterans Population Update
- 2019-09-13: The Supplemental Poverty Measure
- 2019-08-31: Unionization in the Pittsburgh Labor Market
- 2019-06-24: College-Educated Women in the Workforce
- 2019-05-07: Pittsburgh's Opportunity Occupations
- 2019-04-18: 2018 Population Estimates
- 2019-04-08: Homeownership in Pittsburgh
- 2019-03-25: Understanding Regional Occupation Shifts 2010-2017
- 2019-02-11: Pittsburgh's highly educated immigrants
- 2019-01-28: Ongoing demographic change in the City of Pittsburgh
- 2019-01-10: Pittsburgh's North Side and what might have been
- 2019-01-04: How low has Pittsburgh's unemployment rate ever gone?
- 2018-12-18: Expanding Research Employment in the Pittsburgh Region
- 2018-12-13: County-Level Gross Domestic Product (GDP) Estimates Now Available
- 2018-11-26: Pittsburgh's unemployment rate compared to the nation
- 2018-11-20: Pittsburgh Redevelopment Circa 1958
- 2018-11-15: Millennials and change in City of Pittsburgh neighborhoods PrevNov15
- 2018-11-09: Veterans in Pittsburgh
3343 Forbes Ave
Pittsburgh, PA 15260
ucsur@pitt.edu · 412-624-5442